Disclaimer: I am in no way a mathematician. I do want to become one but this is off-topic. Given that, please take everything below with a grain of salt. If you spot any mistakes in my story below, please do let me know and I will be happy to fix.
This effort started after reading a comment on Hacker News that referenced an article by Avi Wigderson that stated the following:
For the Riemann Hypothesis, the explicit sequence of instructions called the Möbius function is determined as follows for each step $t$. If $t$ is divisible by any prime more than once then the instruction is Stay (e.g., $t=18$, which is divisible by $3^2$). Otherwise, if $t$ is divisible by an even number of distinct primes, then the instruction is Right, and if by an odd number of distinct primes, the instruction is Left (e.g., for $t = 21 = 3\times7$ it is Right, and for $t = 30 = 2\times3\times5$ it is Left). This explicit sequence of instructions, which is determined by the prime numbers, causes a robot to look drunk, if and only if the Riemann Hypothesis is true!
I read this comment while being on the plane and thought to myself that it would be interesting to see how the walking function constructed from the Möbius function look like. I wrote the following bash script to generate sums of Möbius function per integer for integers between $0$ and $100,000$. Here is the script:
#!/bin/bash

MAX=100000
FACTOR=/usr/local/opt/coreutils/libexec/gnubin/factor

NEEDLE=0
echo "0,$NEEDLE" > data.csv

for NUM in $(seq $MAX);do
	RES=$($FACTOR $NUM | tr ' ' '\n' | sed -n '1!p'| sort)
	if ! [[ $(echo "$RES" | uniq -d) ]]; then
	    NUMOFPRIMES=$(echo "$RES" | wc -l)
	    if (( $NUMOFPRIMES % 2 )); then
	        let "NEEDLE=NEEDLE-1"
	    else
	        let "NEEDLE=NEEDLE+1"
	    fi
	fi
	echo "$NUM,$NEEDLE" >> data.csv
done
As you can see I just reused the factor tool together with some other standard UNIX utilities.
For plotting the function I used gnuplot 5. Here is the gnuplot script I used:
set terminal png size 2048,1024
set output 'walk.png'
set grid ytics lc rgb "#bbbbbb" lw 1 lt 1
set ytics 10
set grid xtics lc rgb "#bbbbbb" lw 1 lt 0
set xtics 10000
set datafile separator ","
set key outside right center
set title "Walk function created by aggregating the Möbius function" font "arial,20"
set label "Created using gnuplot by Dima Stopel (2019)" at 82500,95
plot "data.csv" using 1:2 with lines notitle
This generates walk.png with the plot. Here is the result:
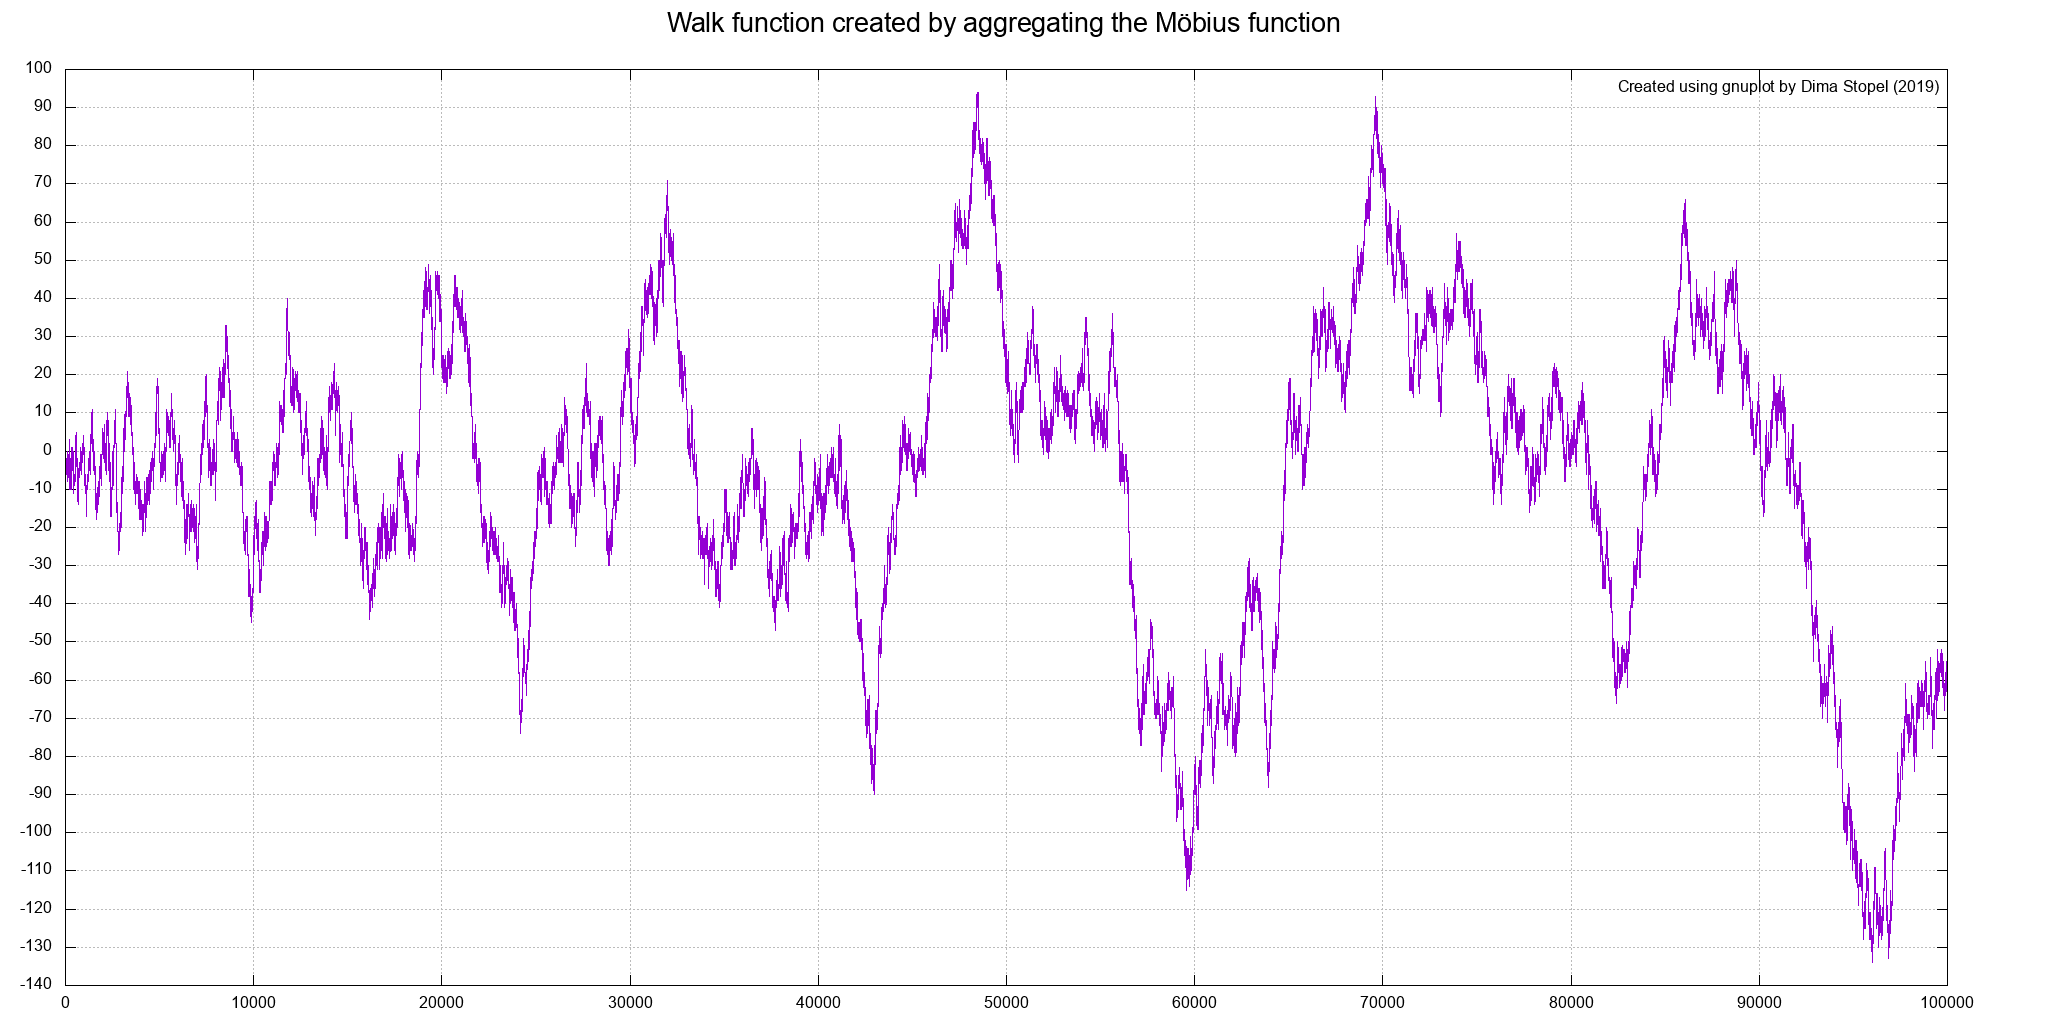
Looks like random walk indeed! Note that although it does look like a typical random walk it is not random at all. Generating it again will, obviously, result the same plot. I suggest to compare it visually to some other, real, random walk examples. You can also generate one here.
Another interesting observation is that at no point the function crosses the $\frac{\sqrt{t}}{2}$ distance from the $x$ axis. For example for $t\simeq48000$ the value is close to $100$, but it is still lower than $\frac{\sqrt{48000}}{2} = 109.54$. From what I understand this is connected to the hypotheses itself that states that all Riemann function zeros are located at the $\frac{1}{2}+{a}\cdot{i}$ line (except trivial zeros). Here $\frac{1}{2}$ relates to the square root ($\sqrt{t}=t^\frac{1}{2}$) observation. Explaining this thoroughly is beyond my current knowledge, though.
Thanks for reading!